
1. Anchor on Action and Status
Establish whether the setup is forming, waiting, confirmed, invalidated, or completed before interpreting its geometry.
Article
A detailed guide to classical bias, realized breakout, alignment, structure pivots, Elliott Zigzag and Double Three codes, geometry, validation, alternative targets, lifecycle, and Pattern ID.
Signal field guide · Part 2
The first lines of a Discord or Telegram signal tell you what is happening now. The Technical context section explains why the setup received that interpretation. This second part shows how to read bias, pivots, geometry, Elliott codes, validation, targets, and lifecycle without turning descriptive fields into false certainty.
Read in layers
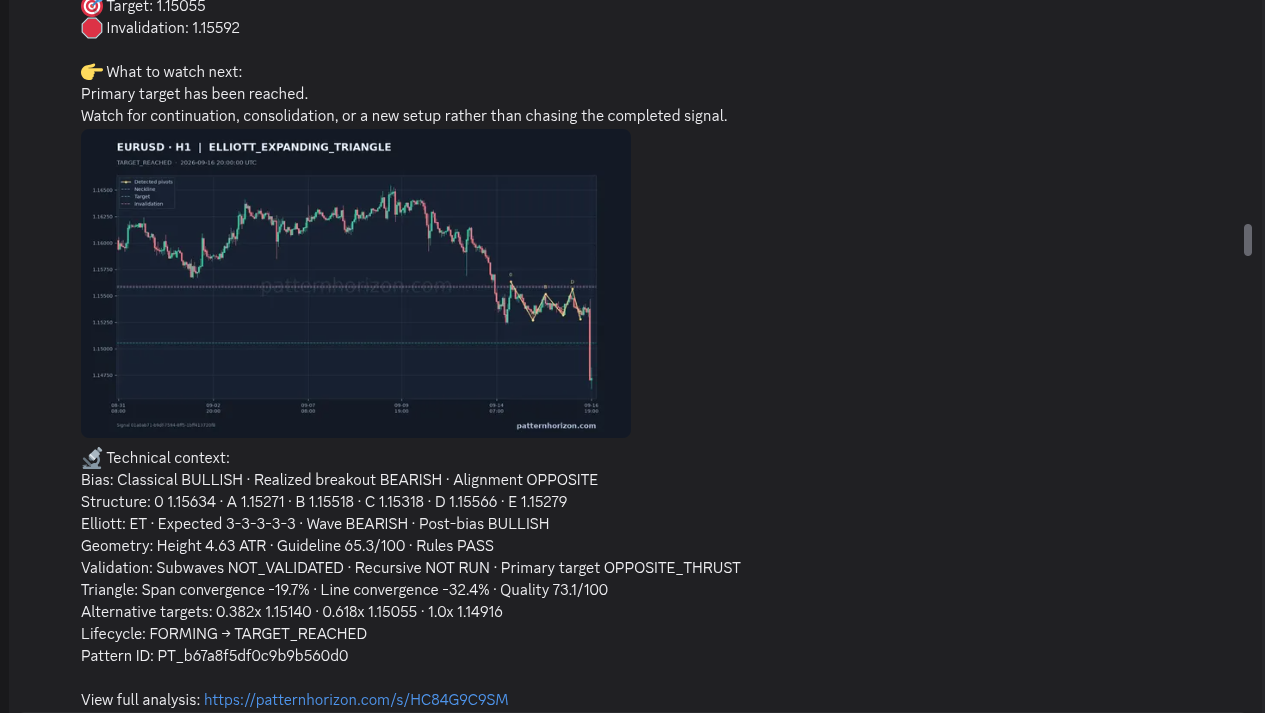
Long notifications are easier to understand when separated into layers. The header identifies the symbol, timeframe, and pattern. Action, Status, and Direction summarize the current state. Price, key level, target, and invalidation anchor that state to the market. Technical context then exposes deeper information about the detected structure and the relationship between the classical pattern expectation and what price actually did.
Start with the current state before reading the deeper fields. A beautifully formed Elliott structure that is marked FAILED is still a failed current setup. A HIGH geometry score while Status is AWAITING_CONFIRMATION does not upgrade the signal to confirmed. A TARGET_REACHED message reports a completed milestone even if the technical context remains bullish or bearish. This hierarchy prevents static pattern characteristics from overpowering lifecycle evidence.
Not every signal contains every technical field. Pattern families use different measurements, and a field can be absent when it is not applicable or not available. Missing is not automatically negative. Read what is present, avoid inventing values, and use the full-analysis page when a mobile notification truncates the technical section.
Directional context
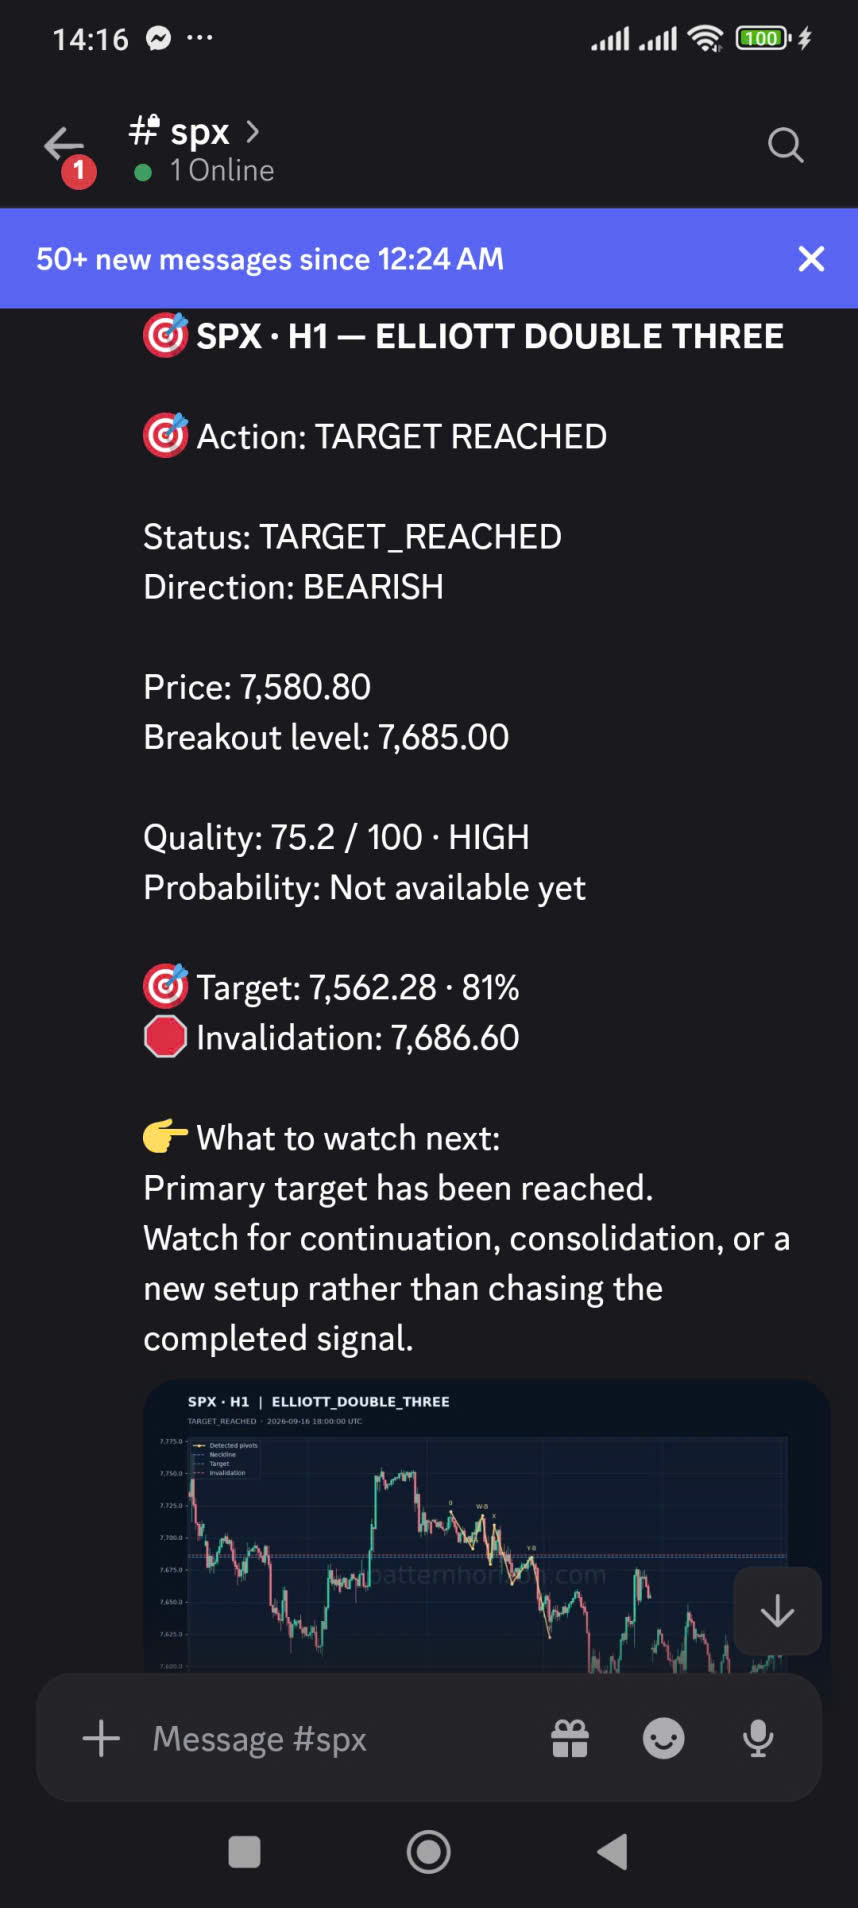
Classical bias is the direction traditionally associated with the detected pattern geometry. It describes the textbook orientation of the structure before later price action is considered. Realized breakout is the direction that the platform recorded when price actually broke the relevant boundary. Alignment compares these layers. CLASSICAL means the realized move agrees with classical bias; OPPOSITE means it broke the other way; NEUTRAL or an unresolved value means there is no clean directional agreement to report.
Direction near the top of the message is the current normalized orientation of the signal. Post-pattern bias, when present in Elliott context, describes the directional tendency expected after the corrective structure completes. These values may refer to different phases. For a bearish corrective wave, for example, Wave direction can be BEARISH while Post-bias is BULLISH because the correction itself moves down but the larger interpretation anticipates an upward phase afterward.
Do not resolve disagreement by choosing the field you prefer. If Classical BULLISH and Realized breakout BEARISH produce Alignment OPPOSITE, the message is documenting that price contradicted the classical expectation. That is materially different from a clean classical breakout and should be reviewed together with status, invalidation, and current price.
Review signal detailsStructure points
The Structure line lists labeled pivot prices. A simple correction may use points such as 0, A, B, and C. A triangle may extend through D and E. A Double Three can include W, X, and Y components, with internal labels for their substructures. These points are the geometry the detector used; they are not separate entry orders. Read them from left to right as a map of how the formation was assembled.
The labels also help you compare the message with the chart. If a signal lists A, B, C, D, and E, find those turning points and check whether current price is still behaving relative to the displayed confirmation and invalidation boundaries. Small numerical differences can occur across instruments because prices use symbol-appropriate precision. The meaningful question is the relationship among the pivots, not the number of decimals.
Elliott code compresses the pattern family. ZZ commonly denotes a Zigzag, a three-part correction usually expressed as 5-3-5. D3 denotes a Double Three, a compound correction typically organized as W-X-Y, where W and Y are corrective structures connected by an intervening X wave. FL denotes a Flat, commonly associated with an expected 3-3-5 sequence. ET denotes an Expanding Triangle, represented by five overlapping legs and commonly shown as 3-3-3-3-3. Codes are useful for scanning, but the Expected wave structure field is the safer reminder of the sequence the system is evaluating.
Elliott focus
A Zigzag is generally a sharper corrective form. Its A and C legs are motive in character, while B is corrective, producing the familiar 5-3-5 expectation. In a signal, read the Structure pivots together with B/A and C/A ratios when available. B/A describes how deeply B retraces A; C/A compares the final leg with the first. These ratios help characterize the geometry, but they do not guarantee that an unfinished C wave will complete. A Zigzag can remain a candidate, wait for confirmation, or fail at invalidation.
A Double Three is a more complex sideways correction. Instead of one A-B-C structure, it links two corrective components through an X wave: W-X-Y. The Components field can identify the component types the system recognized, while Minimum component score reports the weakest included component’s structural score. This prevents a strong-looking aggregate label from hiding a weak internal piece. The longer and more overlapping nature of a Double Three makes confirmation especially important; apparent completion can be revised while price continues to build complexity.
For both patterns, separate Wave direction from Post-pattern bias. Wave direction describes the direction of the corrective structure being tracked. Post-pattern bias describes the expected orientation after completion. Then check Primary target type. THRUST generally points to movement in the projected post-pattern direction; RETRACEMENT or OPPOSITE_THRUST describes a different target relationship. These labels explain the model’s target construction. They are not instructions to enter before confirmation.
Confirmation discipline
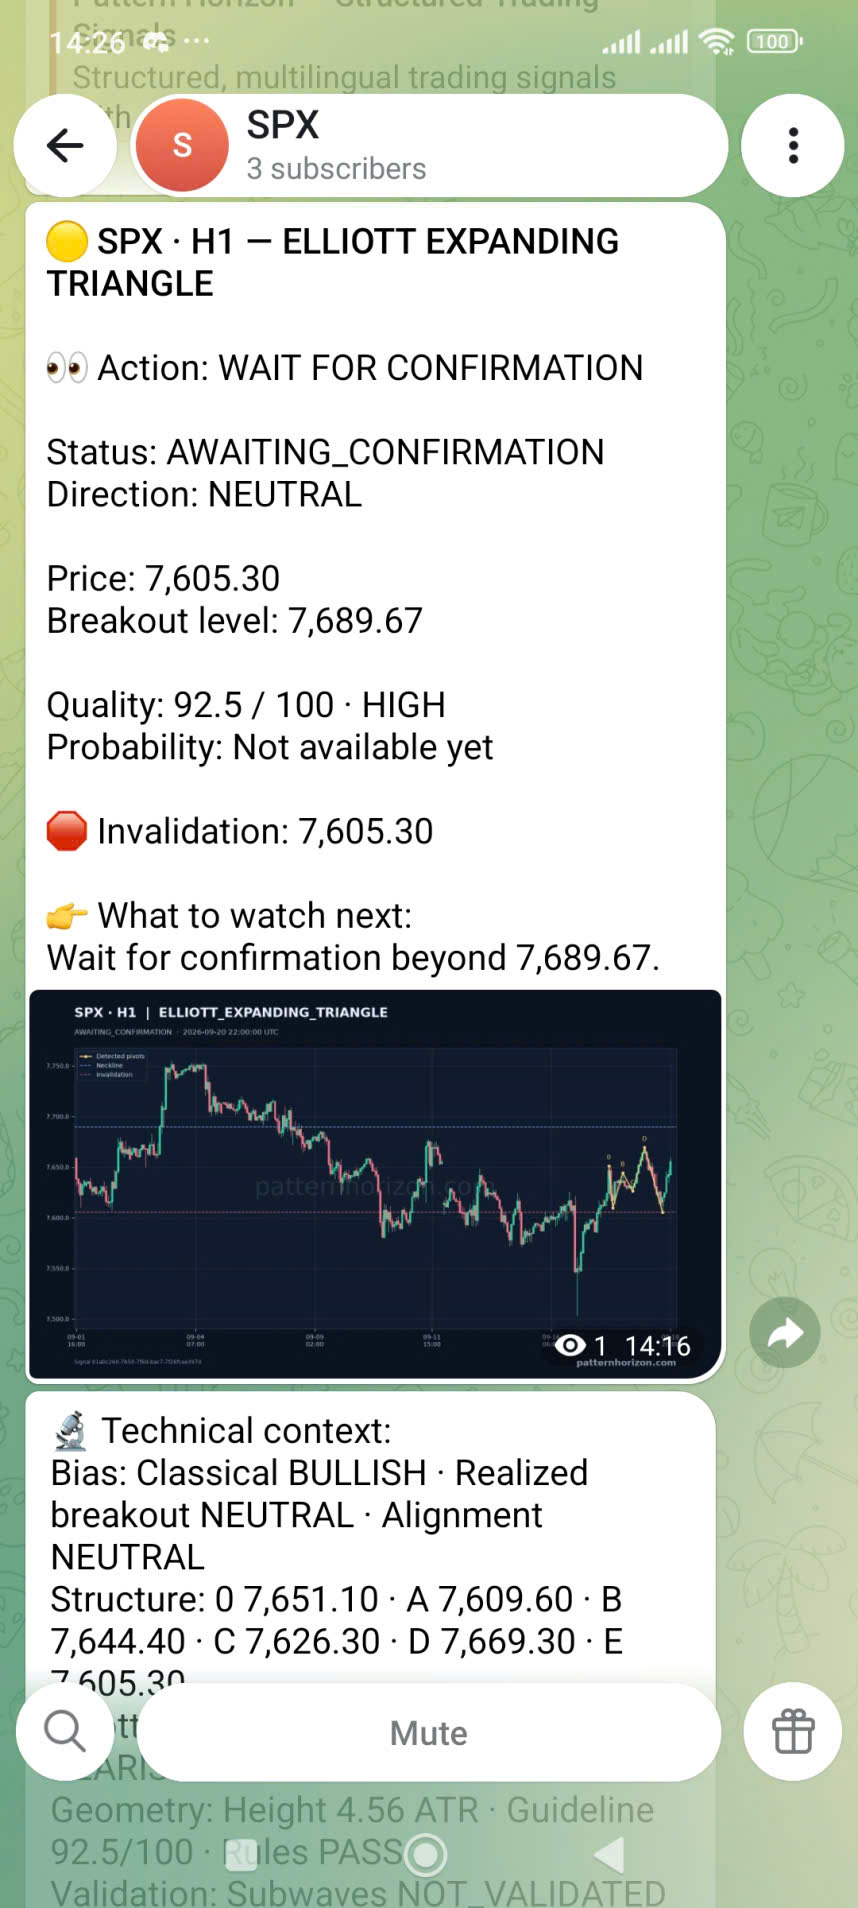
A pattern can score well and still wait for confirmation. The Breakout level or confirmation boundary marks the price reference used by the setup’s rules. When Action says WAIT FOR CONFIRMATION, the system has not recorded the configured confirming event. Avoid converting “almost confirmed” into “confirmed” because price looks close to the level.
Rules PASS indicates that the available geometry satisfies the encoded structural rules for that pattern. Guideline score expresses how well the formation matches softer guidelines. These are related but different: hard rules can pass while the guideline score is only moderate. Subwave validation reports whether the internal wave interpretation has been validated. Recursive validation tells you whether deeper subwave checking was performed and verified; NOT RUN or NOT VALIDATED means that layer should not be assumed.
The invalidation level remains active while waiting. If price violates it before confirmation, the setup can become FAILED even when its earlier quality was HIGH. Conversely, confirmation does not remove risk; it only records that a specific transition occurred. Continue to read target, invalidation, current price, and later lifecycle events.
Open current signalsGeometry and targets
Height measured in ATR compares the pattern’s vertical size with recent average movement, making scale more comparable across instruments. Width in bars measures duration. Head prominence and neckline slope apply to pattern families that use those features. These measurements describe shape; they do not say that a larger or longer pattern must be more profitable.
Wave ratios such as B/A, C/A, W2/W1, W4/W3, W3/W1, and W5/W1 describe proportional relationships among legs. For triangles, Span convergence and Line convergence summarize how the structure’s range and boundaries evolve. An expanding triangle may produce negative convergence values because the span widens rather than contracts. Triangle quality is a pattern-specific geometry score and can differ from the headline quality value.
Alternative targets show projected prices at ratios such as 0.382x, 0.5x, 0.618x, 0.75x, and 1.0x. They are scenario references derived from pattern geometry. The Primary target is the level selected by the platform for lifecycle tracking; alternatives do not create five simultaneous promises. If primary target is reached, the setup can enter TARGET_REACHED even though another projected level is farther away. Chasing a more distant alternative after the primary event ignores the fact that the signal’s recorded milestone has already changed.
Percentages shown beside a target should be read according to their label, such as target probability, and only when available. They are not position-size recommendations.
Deep-reading workflow
Use technical context to investigate the message, not to search for a single number that confirms a preferred trade.
Establish whether the setup is forming, waiting, confirmed, invalidated, or completed before interpreting its geometry.
Identify the current orientation and the textbook pattern orientation, then check Realized breakout and Alignment for agreement or contradiction.
Match the Structure labels and prices to the chart so you understand which legs define the detection.
Use Elliott code, expected wave structure, components, Wave direction, and Post-pattern bias together—especially for Zigzag and Double Three corrections.
Check breakout level, rules, guideline score, subwave status, recursive validation, and invalidation instead of relying on quality alone.
Distinguish the tracked primary target from alternative projections, then follow later lifecycle events rather than assuming every level will be reached.
Context beyond the pattern
Technical context can include the zone role—SUPPORT or RESISTANCE—and assessments from the same timeframe and multiple timeframes. CLEAR_SUPPORT or CLEAR_RESISTANCE indicates relatively clean nearby structure. BETWEEN_OPPOSING_ZONES means price sits between competing areas. OPPOSING_ZONE_CONFLICT and CROSS_TIMEFRAME_ZONE_CONFLICT identify direct disagreement within one timeframe or across timeframes. Immediate support or resistance can also appear with an opposing area nearby.
When a conflict is active, Pattern Horizon may set Action to WAIT / NO CLEAR EDGE and Direction to UNCLEAR even if an individual pattern has a classical bullish or bearish bias. This is deliberate. Pattern geometry and market context answer different questions, and contextual conflict can justify withholding a directional conclusion.
Do not solve multi-timeframe conflict by automatically trusting the longest or shortest timeframe. Instead, decide which horizon belongs to your own method, observe whether price leaves the overlapping area, and wait for a clear reaction or confirmed breakout if that is what the message requests. The system is exposing disagreement so you can see it—not asking you to ignore it.
Follow the same setup
The Lifecycle line can show a transition such as FORMING → TARGET_REACHED or AWAITING_CONFIRMATION → FAILED. It tells you what changed between the relevant events. A status without history answers “where are we now”; a transition also answers “how did we get here.” On the website, timestamps such as Started, Confirmed, Invalidated, and Completed can provide a more complete sequence when available.
Pattern ID or Signal ID is the stable identifier used to associate messages with the same detected setup. It is useful when several patterns of the same type appear on one symbol and timeframe. Do not assume two similar chart thumbnails belong to one lifecycle unless their identity confirms it.
The View full analysis link opens the entitled website detail for the signal event. Use it to inspect a larger chart, normalized fields, event history, and any technical values that a messaging app truncated. If an older notification conflicts with the current website view, prefer the newest recorded state and review the timeline. An update can invalidate or complete an earlier setup without deleting the historical message that first introduced it.
Common reading errors
First, do not read HIGH quality as a high probability of profit. Second, do not treat a classical bias as the current Direction when Realized breakout or Alignment says otherwise. Third, do not treat AWAITING_CONFIRMATION as a weaker spelling of CONFIRMED; it is a distinct state. Fourth, do not use Invalidation as an automatic stop placement without assessing volatility, execution, and position size. Fifth, do not interpret TARGET_REACHED as a fresh invitation to enter at a late price.
A sixth mistake is especially relevant to Elliott signals: counting labels without checking validation. A plausible W-X-Y or A-B-C map can still be unvalidated, revised, or invalidated. Codes and ratios organize the thesis; lifecycle events test it.
The disciplined interpretation is conditional: the system detected this structure, assigned these biases and measurements, and recorded this current state. If confirmation occurs, the lifecycle may advance. If invalidation occurs first, the old setup ends. That conditional language is not a weakness—it is an accurate representation of uncertain markets.
Put the two parts together
Review Pattern Horizon signals with a consistent sequence: scope, current state, market levels, structural context, confirmation, invalidation, and lifecycle history.
View signalsImportant information
Pattern Horizon provides market information and educational content only. Elliott labels, quality scores, probability fields, projected targets, confirmation levels, and lifecycle states are not personalized investment advice and do not guarantee performance. Any pattern can fail, data and notifications can be delayed, and actual execution can differ from displayed references.
Independently verify current conditions, decide whether the analytical timeframe matches your approach, account for spread, slippage, liquidity, leverage, and possible loss, and seek qualified professional advice when appropriate. The platform helps organize evidence; responsibility for every trading or investment decision remains with the user.