
1. Read symbol and timeframe first
Treat XAUUSD H1 and XAUUSD H4 as separate analytical objects, even when they arrive close together.
Article
Learn what a signal timeframe means, why H1 and H4 can show different but valid structures, and how to combine timeframe, lifecycle, confirmation, zones, and risk without assuming that a higher timeframe is always more accurate.
Signal reading guide
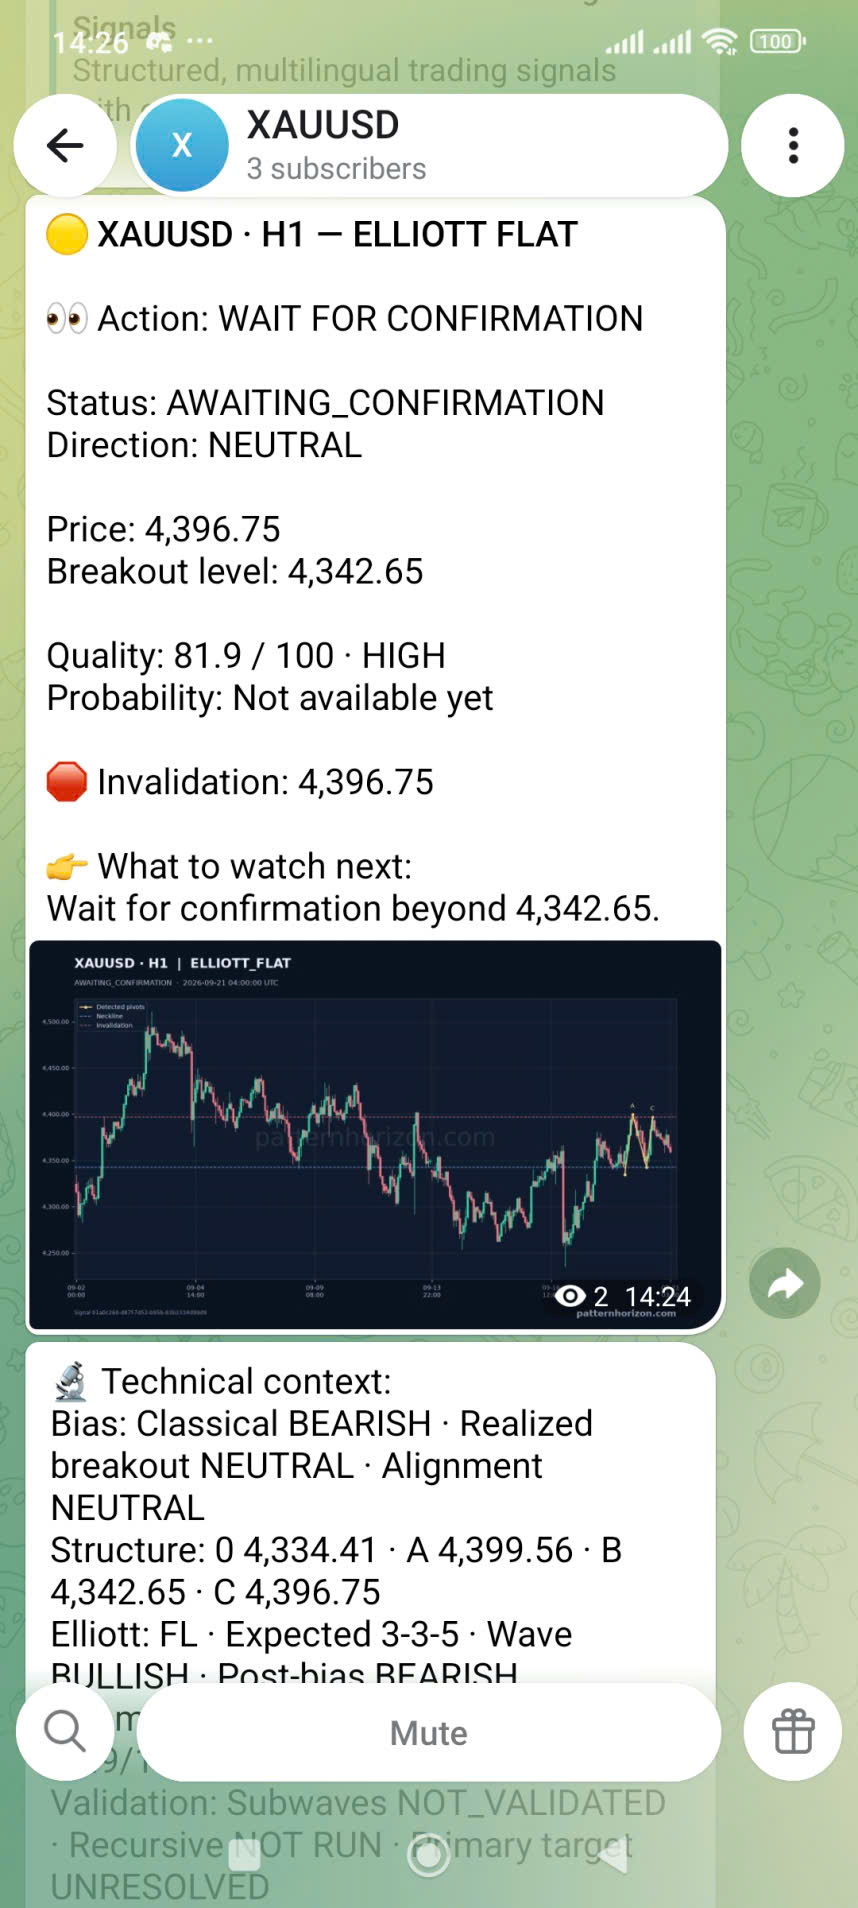
The timeframe beside a symbol is not a minor label. It defines the interval used to build the candles and the analytical horizon in which the structure was detected. An XAUUSD H1 signal and an XAUUSD H4 signal can describe the same market at the same moment while answering different questions. Reading them correctly means keeping each structure attached to its own timeframe, lifecycle, levels, and evidence.
Start with the label
On an H1 chart, each completed candle represents one hour of price activity. On H4, each completed candle represents four hours. The pattern engine evaluates pivots, zones, geometry, breakouts, and other evidence on data organized at that interval. Therefore, H1 and H4 are not two magnifications of one identical object; they can produce different pivots, boundaries, states, and confirmation times.
A lower timeframe usually updates its candles and local structure more frequently. It can reveal an approach, touch, rejection, or small breakout before the same movement becomes meaningful on a higher timeframe. A higher timeframe aggregates more price activity into each candle, so its structure generally evolves more slowly and can frame a broader market move. “Faster” does not mean better, and “slower” does not mean safer. They are different analytical horizons.
Before reading Direction, Quality, Target, or Invalidation, verify symbol and timeframe in the message headline. A technically correct observation becomes misleading if it is mentally transferred to another timeframe.
Different questions
Imagine price rising from an H1 support zone while it remains inside an H4 resistance zone. The H1 observation can correctly describe local support and a short-horizon reaction. The H4 observation can simultaneously describe a broader obstacle. Neither cancels the other. The conflict appears only when a user treats the H1 reaction as proof that the H4 resistance no longer matters, or treats the H4 resistance as proof that no H1 rally can occur.
The same principle applies to chart patterns. An H1 Elliott correction can be a component of a larger H4 structure. An H1 confirmation can record that price crossed the configured H1 boundary, but it does not automatically confirm an H4 pattern whose boundary and candle conditions are different. Conversely, an H4 setup can remain FORMING while several H1 structures complete inside it.
Use the timeframe to define the scope of every statement: support on which timeframe, breakout of which boundary, confirmation under which candle interval, and invalidation of which setup? This prevents a local event from being promoted into a market-wide conclusion.

Multi-timeframe context
Pattern Horizon may identify CROSS_TIMEFRAME_ZONE_CONFLICT when nearby support and resistance from different timeframes compete. The integrated Direction can become UNCLEAR and the Action can become WAIT / NO CLEAR EDGE. This does not mean every underlying observation is wrong. It means the combined evidence does not currently justify a strong directional summary.
Read which timeframe produced the immediate zone, which produced the opposing zone, whether price is approaching, touching, inside, or leaving either area, and what observable event could reduce the conflict. A reaction on H1 may matter locally while the H4 barrier remains active. A sustained move beyond the higher-timeframe boundary can change that relationship, but it should be recorded rather than assumed.
Multi-timeframe analysis is most useful when it preserves disagreement. Hiding a conflict can create false confidence; labeling it helps the user wait for clearer evidence.
Read the conflict guideTime and state
A lower timeframe can generate more state changes because candles complete more often and price interacts with smaller structures more frequently. A higher-timeframe setup can remain FORMING or AWAITING_CONFIRMATION for longer because its evidence is evaluated on larger candle intervals. The extra waiting time is not itself confirmation and is not automatically a sign of greater quality.
The meaning of the labels remains consistent. FORMING indicates that a recognizable structure is developing. AWAITING_CONFIRMATION indicates that the system has a candidate but the configured confirmation event has not yet occurred. CONFIRMED records that the relevant condition was satisfied. TARGET_REACHED records the tracked primary target outcome. FAILED or INVALIDATED closes the previous hypothesis under its invalidation rule.
Always compare the timestamp of the latest update with the timeframe. An H4 signal may not change simply because several H1 candles have moved. Its next meaningful evaluation can depend on an H4 candle condition or a boundary defined by the H4 pattern. Use the real-time update as a lifecycle record, not as an instruction to anticipate the next state.
Confirmation belongs to its setup
Confirmation is tied to the detected structure and its configured Breakout level or other boundary. If an H1 signal becomes CONFIRMED, that transition applies to the H1 setup. It cannot be copied to an H4 pattern just because both share a symbol or directional bias. The H4 setup must satisfy its own confirmation rule.
The opposite is also important. A confirmed H4 direction does not guarantee that every H1 setup aligned with it will succeed. The lower timeframe can contain corrections, failed formations, support/resistance conflicts, or opposing patterns. Higher-timeframe alignment can be useful context, but it does not remove the lower-timeframe invalidation level or replace the need to read its current state.
When timeframes agree, describe the agreement precisely: for example, an H1 bullish setup confirmed while H4 context is also bullish. When they disagree, keep both observations and look for the event that would resolve or preserve the disagreement. Avoid compressing multiple layers into a single BUY or SELL conclusion.
The timeframe does not remove uncertainty
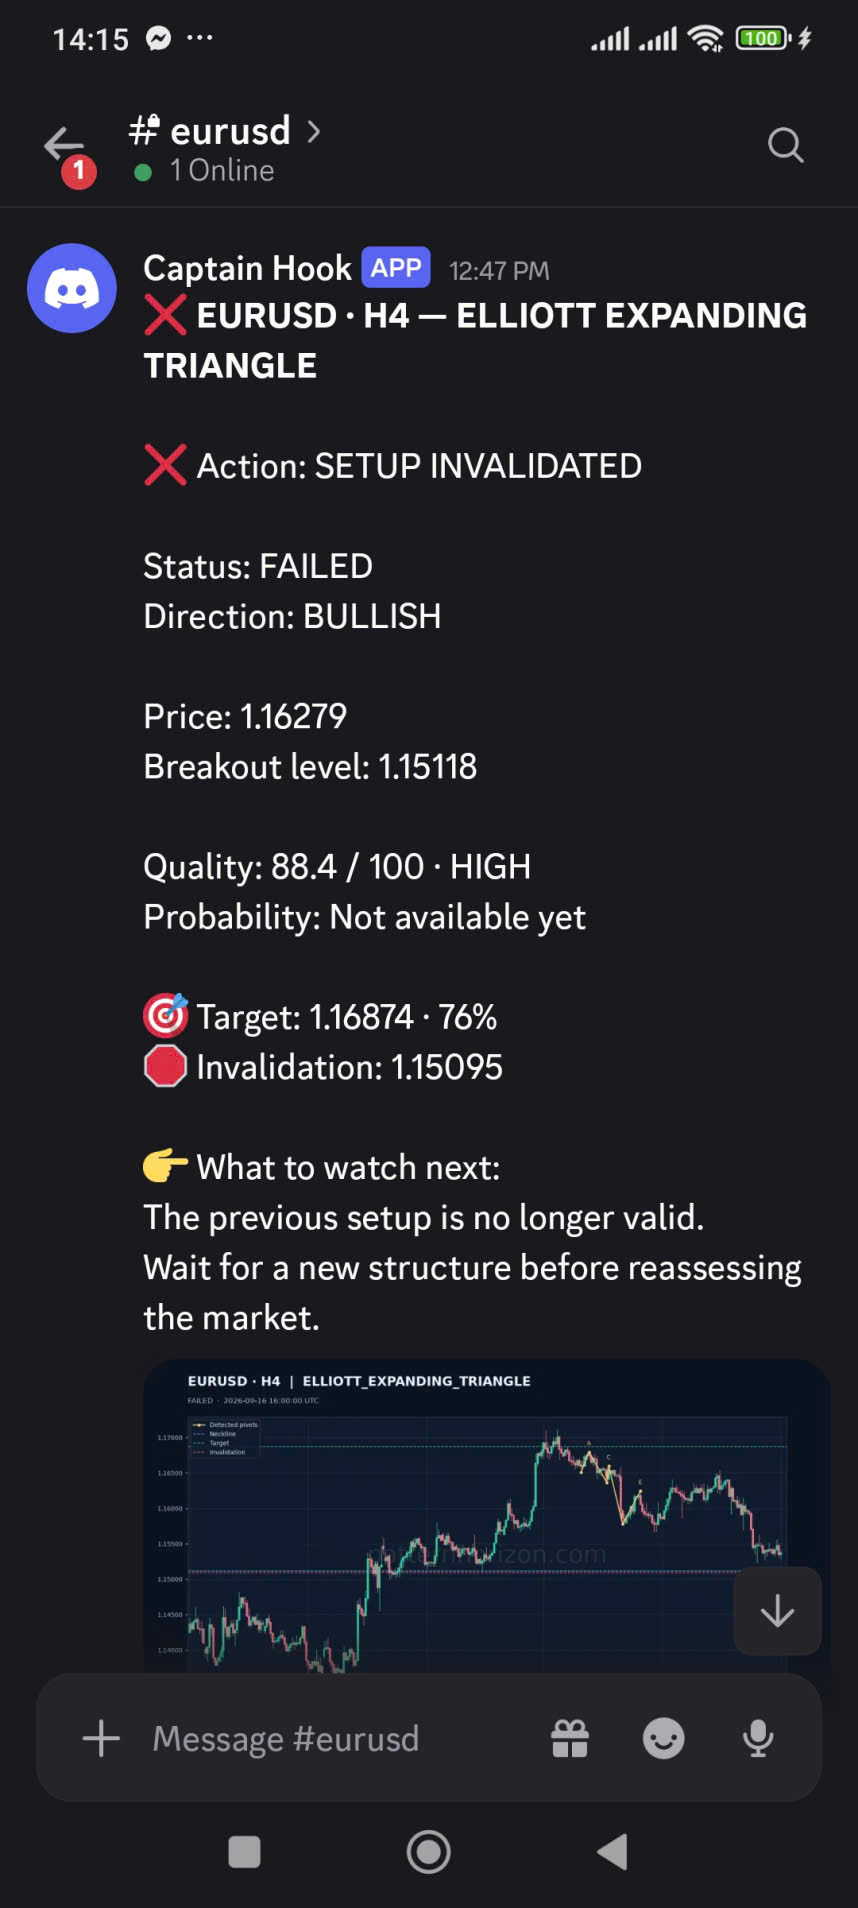
The illustrated EURUSD H4 message records a HIGH-quality Elliott structure that later became FAILED. It is a useful reminder that a higher timeframe and a strong Quality score do not guarantee a target outcome. H4 describes the interval of the pattern; HIGH describes structural assessment; FAILED describes the later lifecycle result. These are separate fields.
The correct response to FAILED is not to reinterpret the old setup until it looks successful. The message states that the previous setup is no longer valid and that a new structure should be awaited before reassessing the market. A failure also does not automatically confirm the opposite direction.
This example should not be used to claim that H4 is unreliable. One screenshot cannot establish accuracy for any timeframe. It demonstrates how timeframe, Quality, Direction, Target, and Invalidation must remain distinct when reviewing an outcome.
Review signal statesWhich timeframe is more accurate?
It is tempting to say that H4 is more accurate because it contains more data per candle, or that H1 is better because it reacts earlier. Neither statement is reliable without a defined study. Accuracy can vary by symbol, pattern family, market regime, confirmation method, target and invalidation rules, data quality, and the period measured. A slower timeframe may filter some short-term noise while producing fewer examples and wider price distances. A faster timeframe may offer more observations while also recording more local reversals.
A valid comparison should define the sample period, symbols, signal families, minimum Quality, state at observation, target definition, invalidation rule, expiry treatment, and whether incomplete setups are included. H1 and H4 should be evaluated under comparable rules, not selected after seeing which examples worked. Results should report sample size and uncertainty, and should not turn historical outcomes into a promise.
Until Pattern Horizon publishes a reviewed performance study, the platform should not claim that one timeframe has a universal win rate advantage. Users should choose an analytical horizon that fits their own review process and risk constraints, then evaluate signals within that timeframe consistently.
A seven-step comparison
The aim is to preserve each layer of evidence before forming an independent view.
Treat XAUUSD H1 and XAUUSD H4 as separate analytical objects, even when they arrive close together.
Separate chart patterns from support/resistance zones because their states, scores, and boundaries can be represented differently.
One setup may be CONFIRMED while another is FORMING, AWAITING_CONFIRMATION, in a zone, or already invalidated.
Record the breakout, target, invalidation, support, or resistance level belonging to each timeframe. Do not merge them.
Note where direction agrees, where zones oppose it, and whether the integrated context reports no clear edge.
Use observable state transitions or sustained movement beyond the relevant boundary instead of predicting the next label.
Account for price, volatility, liquidity, spread, slippage, leverage, and possible loss; timeframe does not choose position size for you.
Common mistakes
Timeframe hopping occurs when a user starts with one setup, then switches to another timeframe only because the original interpretation became uncomfortable. An H1 invalidation should not be dismissed by pointing to an unfinished H4 pattern. Likewise, an H4 conflict should not be ignored because a smaller H1 pattern briefly confirmed. Review the state that belongs to the original setup and decide whether a new analysis is genuinely separate.
Other mistakes include comparing raw Quality scores across unrelated pattern families, assuming higher timeframe means guaranteed higher accuracy, treating a lower-timeframe wick as confirmation of a higher-timeframe breakout, and reading every aligned signal as duplicate proof. Several signals can share the same underlying price movement, so they are not automatically independent evidence.
Telegram and Discord are delivery channels. Use their headline to identify symbol, timeframe, Action, and Status, then open the full analysis when context matters. Do not let notification speed replace structured review.
Keep every signal in its own horizon
Open the signal feed and practice separating local structure from higher-timeframe context.
View signalsImportant information
Pattern Horizon provides market information and educational content only. Timeframes, patterns, states, directions, scores, targets, and invalidation levels are not personalized investment advice and do not guarantee profit or prevent loss. Market conditions can change quickly, patterns can fail, and actual execution can differ from displayed references.
Independently verify current prices and conditions, understand the instrument, and account for liquidity, volatility, spread, slippage, leverage, and possible loss. Decide whether any analytical horizon or setup fits your own method and circumstances, and seek qualified professional advice where appropriate.