
1. Verify symbol, timeframe, and pattern or zone name
Technical fields belong to the exact detection shown in the headline.
Article
A field-by-field guide to Pattern Horizon Technical context, including bias and alignment, pivots, Elliott structure, geometry, rule checks, subwave validation, ratios, target type, lifecycle, and Pattern ID.
Advanced signal guide
The notification headline tells you what changed. Technical context explains how the structure was interpreted. Depending on the signal family, it can show classical bias, realized breakout, alignment, labeled pivots, Elliott code, geometry, validation, ratios, alternative targets, zone conflict, lifecycle, and Pattern ID. Not every row appears on every signal; each field should be read only within the structure and state that produced it.
Headline versus detail
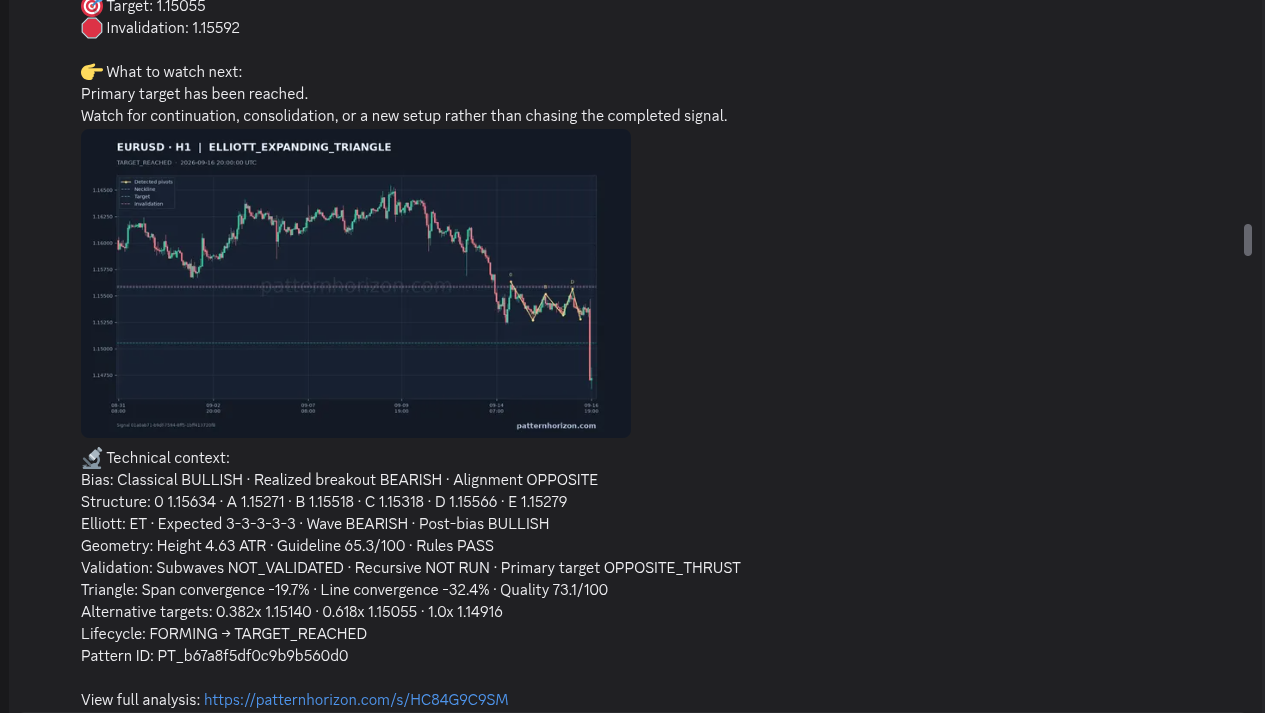
Action, Status, and Direction summarize the current update. Technical context exposes the structured evidence behind that summary. A pattern can have Classical BULLISH bias while the headline Direction is BEARISH because the realized breakout occurred in the opposite direction. A zone can have a clear local role while integrated Direction is UNCLEAR because another timeframe supplies opposing evidence.
Always read the headline first. A technically interesting structure can still be FORMING, AWAITING_CONFIRMATION, FAILED, or already TARGET_REACHED. Technical context should not be used to promote an earlier lifecycle state into a later one.
The detail is most useful for answering precise questions: which pivots define the pattern, which direction was expected, what price actually did, which rule checks were available, whether subwaves were validated, what target type was selected, and which event is current.
The Bias row
Classical bias is the conventional directional orientation associated with the detected pattern. It describes the model's textbook interpretation, not a guaranteed next move. Realized breakout records the direction price actually took when valid breakout evidence became available. Before that event, it can remain NEUTRAL.
Alignment compares the two. CLASSICAL means realized direction agrees with classical bias. OPPOSITE means price broke against the classical orientation. NEUTRAL means the comparison is unresolved or no realized direction is available.
These fields intentionally preserve both expectation and outcome. The engine does not rewrite a bullish classical pattern as bearish simply because price broke lower. It records Classical BULLISH, Realized breakout BEARISH, Alignment OPPOSITE. Read the headline Direction for the current orientation and the Bias row for how that orientation relates to the original structure.
The Structure row
Structure lists the detected pivots and their prices. Elliott corrections can display labels such as 0, A, B, and C. More complex structures can use additional points such as D and E. Other pattern families can show their own defining points or neckline references.
The row is a compact map, not a complete chart. It helps users compare the labels in the rendered image with the numerical prices used by the detection. The order, spacing, and relationship between pivots matter more than any isolated point.
Do not move a pivot from one timeframe to another or redraw it after seeing the result. The listed structure belongs to the Pattern ID and event revision being shown. If the lifecycle later invalidates or replaces the setup, the original pivot map remains historical context rather than a permanent market forecast.
The Elliott row
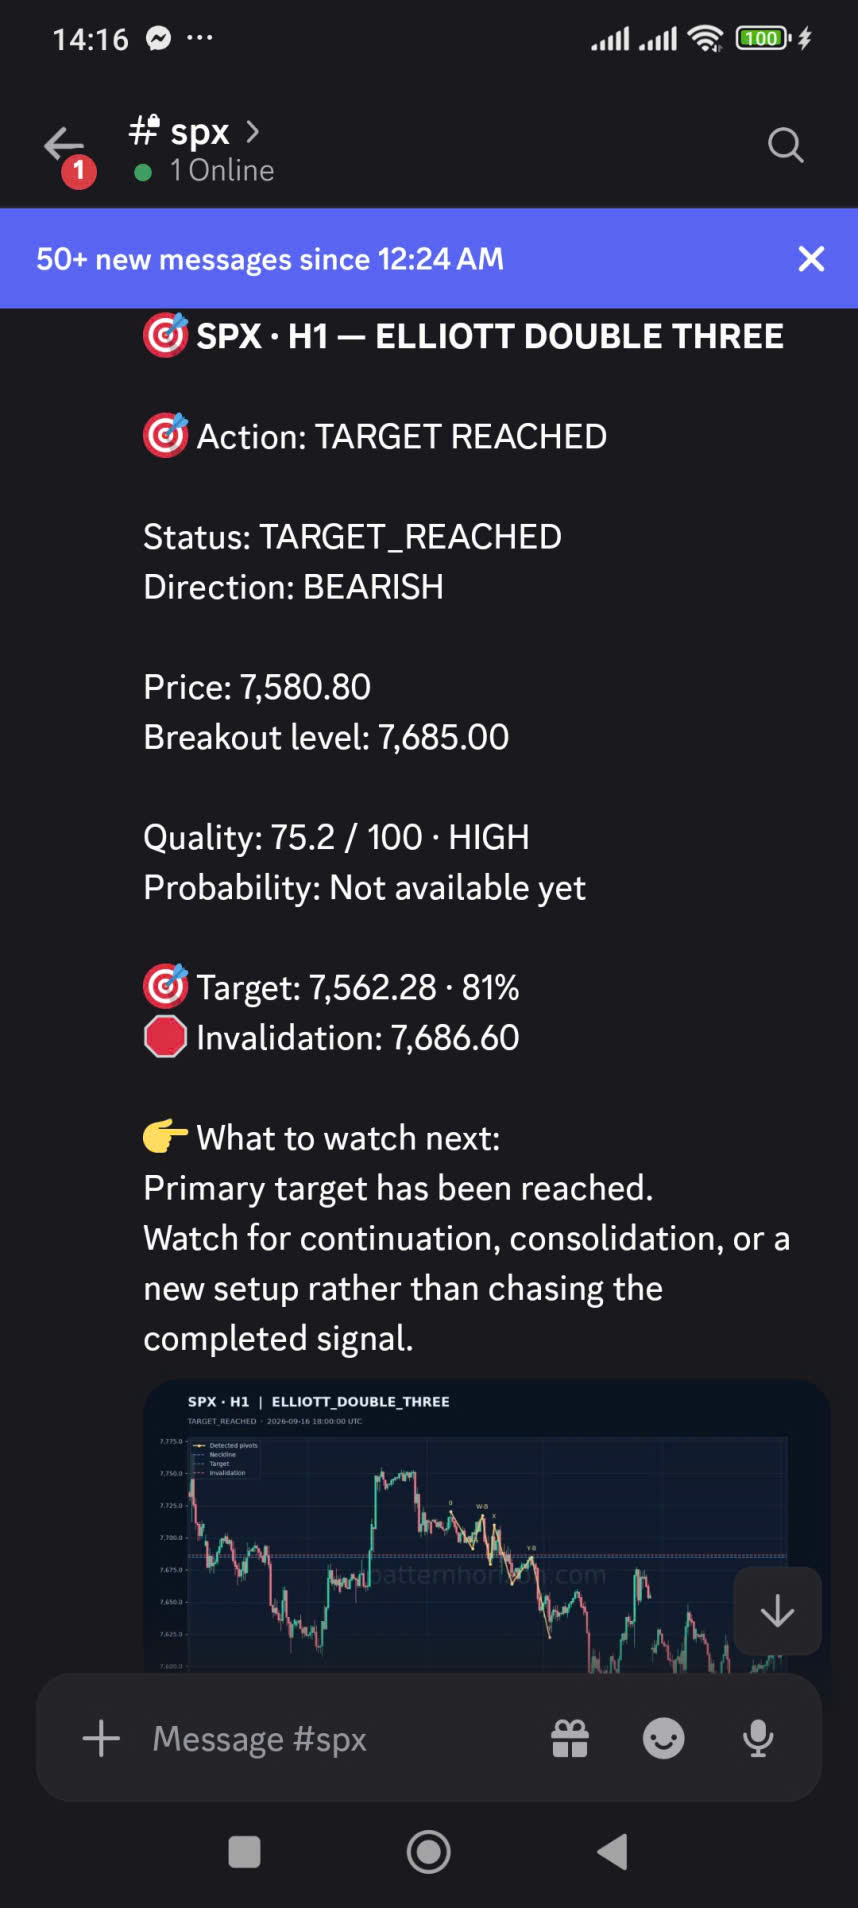
An Elliott line can show a compact code such as ZZ for Zigzag, DT for Double Three, FL for Flat, or another supported structure. Expected describes the intended internal sequence, such as 5-3-5 or 3-3-3, according to the detected family.
Wave Direction describes the orientation of the structure being traced. Post-bias describes the directional interpretation expected after the corrective structure under the pattern model. They should not be collapsed. A correction can develop in one direction while its post-pattern bias points the other way.
The illustrated Double Three example shows why the compact name alone is insufficient. Read the labeled pivots, expected wave structure, current lifecycle, realized direction, and validation fields before forming a view.
Read the Elliott guideThe Geometry row
Height expressed in ATR places the pattern's price range relative to recent volatility. A structure spanning several ATR is large relative to that volatility measure, but size alone does not make it valid or profitable.
Guideline score summarizes applicable pattern guidelines on a 0–100 style scale where available. Rules PASS or FAIL records whether required rule checks succeeded. Guidelines and hard rules should not be treated as the same thing: a structure can fit many guidelines while a required rule remains decisive.
Other pattern families can expose different geometry fields, such as triangle convergence, cup roundedness, handle proportions, neckline, or pattern height. Read only the fields presented for that family. Do not add sub-scores together or convert them into a win probability unless a reviewed methodology explicitly defines that calculation.
The Validation row
Subwaves can be VALIDATED, NOT_VALIDATED, or another supported validation state depending on available analysis. Recursive validation records whether deeper subwave analysis was run and what it found. These fields describe a specific validation layer; they should not be confused with the signal's lifecycle Status.
For example, a setup can be confirmed at the headline level while recursive subwave validation was not run. That does not mean the word CONFIRMED should be erased, and it does not mean missing validation should be treated as a pass. It means the reader should preserve both facts.
Primary target kind explains which target logic was selected, such as a retracement-oriented objective, an opposite-direction thrust, or an unresolved target type. The target kind provides context for the displayed Target; it does not guarantee that price will reach it.
Ratios and alternative targets
Motive structures can show relationships such as W2/W1, W4/W3, W3/W1, or W5/W1. Corrective structures can show B/A, C/A, X/W, Y/W, or other family-specific ratios. These values help explain how the detected pivots relate to the expected structure.
Alternative targets can list several geometric projections, for example 0.382x, 0.618x, or 1.0x references. They are scenario levels derived from the structure, not several guaranteed destinations. The headline Target remains the primary objective tracked by the lifecycle when available.
Do not select the most favorable ratio after the move and present it as though it had been the only forecast. Reliable review preserves the original fields, timestamp, primary target, invalidation, and all outcomes.
Lifecycle and identity
The Lifecycle row can summarize a transition such as FORMING → CONFIRMED or another relevant path. It tells you which state changed in the current event. Always compare it with the headline Status because a later event can move the same tracked setup to TARGET_REACHED, FAILED, INVALIDATED, EXPIRED, or AMBIGUOUS.
Pattern ID is a technical identifier for the detected structure. It is useful when comparing notifications, the website detail view, event history, or diagnostic records. Similar-looking patterns on the same symbol and timeframe can still have different IDs.
The View full analysis link connects the compact notification to the richer website record. Use it when a screenshot or mobile preview truncates Technical context, especially before comparing pivots, ratios, zones, or multiple lifecycle events.

Zone Technical context
A zone signal does not need Elliott pivots or wave ratios. Its Technical context can identify the zone as SUPPORT or RESISTANCE, show the lower and upper boundaries, summarize same-timeframe context, and report multi-timeframe context.
Local context can describe support confluence, resistance confluence, or opposing-zone conflict. Multi-timeframe context can show an immediate zone together with nearby support or resistance from another timeframe. When evidence competes, Direction can become UNCLEAR and Action can become WAIT / NO CLEAR EDGE.
The illustrated conflict contexts show why a valid local zone does not automatically dominate the full reading. Keep role, state, range, timeframe, and opposing structures separate.
Read the zone lifecycle guideA complete reading order
The sequence prevents an advanced field from being interpreted without its current lifecycle and market context.
Technical fields belong to the exact detection shown in the headline.
Locate the current lifecycle before interpreting geometry or ratios.
Compare current event price with breakout, target, invalidation, or zone boundaries.
Separate classical expectation from realized breakout and integrated Direction.
Match labeled pivots and prices to the rendered chart without redrawing them after the outcome.
Use Elliott, geometry, rules, validation, and ratios only where that pattern family provides them.
Confirm that the notification is current and identify later events for the same setup.
Technical detail does not replace verification of volatility, liquidity, spread, slippage, leverage, and possible loss.
Common mistakes
Avoid reading Classical bias as realized Direction, Rules PASS as guaranteed success, NOT_VALIDATED as automatic failure, or an alternative target as a promised destination. Do not add Guideline score, Quality, and ratios into an invented confidence value.
Do not compare the technical rows of unrelated pattern families as if every score used the same definition. Do not transfer pivots or targets across timeframes. Do not keep analyzing an old FORMING screenshot after the current signal has become FAILED or TARGET_REACHED.
Technical context is valuable because it exposes assumptions and evidence. Its purpose is not to make the market certain; it lets users see which parts are known, pending, conflicting, or unavailable.
Move beyond the headline
Open a signal, match its pivots and levels to the chart, and follow the latest lifecycle event before forming an independent view.
View signalsImportant information
Pattern Horizon provides market information and educational content only. Bias, alignment, structure, geometry, validation, ratios, scores, targets, zones, and lifecycle states are not personalized investment advice and do not guarantee profit or prevent loss. Models and detections can be incomplete, invalidated, or affected by changing market conditions.
Independently verify current prices and conditions, understand the instrument, and decide whether any setup fits your own method and circumstances. Account for liquidity, volatility, spread, slippage, leverage, and possible loss, and seek qualified professional advice where appropriate.