
1. Verify symbol and timeframe
Confirm which market and analytical horizon produced the score. Do not transfer a quality assessment to another timeframe.
Article
Learn what Pattern Horizon’s Quality field measures, how it differs from probability and confidence, and why a structurally strong pattern can still reach its target, fail, or remain unconfirmed.
Pattern evaluation guide
Quality is one of the most visible numbers in a Pattern Horizon signal—and one of the easiest to misunderstand. A HIGH score describes how well the detected structure fits the system’s criteria. It does not promise that price will reach a target, and it should never be converted directly into position size or expected profit.
The question Quality answers
When Pattern Horizon displays “Quality: 81.9 / 100 · HIGH,” the number summarizes the detected pattern’s structural assessment under the fields available to the system. Depending on the pattern family, that assessment can reflect rule fit, geometry, guideline agreement, component quality, or another applicable structural measure. For a support or resistance signal, the interface may instead show a Zone score because zone quality is represented differently from pattern geometry.
Quality therefore answers a limited but useful question: how well does this detection match the structural criteria used for this kind of setup? It does not answer: will this trade make money, will the target be reached, how much should a user risk, or what price can be executed? Those questions require other information and, in several cases, personal decisions the platform cannot make.
The distinction matters because market patterns are observations made under uncertainty. A formation can be clean, symmetrical, and compliant with encoded rules while price later responds to new information, liquidity, volatility, or a stronger structure on another timeframe. Quality evaluates the observed setup; it does not control what the market does next.
Score and label
Pattern messages can present a numeric score out of 100 plus a qualitative label such as HIGH, MEDIUM, or LOW. The label makes scanning easier, while the number preserves more detail. A value near the boundary between two labels should not be treated as fundamentally different simply because the word changes. The score is a continuum, not a switch that turns risk off.
The headline Quality value may coexist with more specific technical fields. An Elliott signal can include Guideline score, Rules PASS or FAIL, component scores, wave ratios, subwave validation, or triangle quality. These values examine different aspects of the same structure and should not be added together. A HIGH headline score does not overwrite an unvalidated subwave field, and a strong triangle-specific score does not automatically confirm a breakout.
The safest interpretation is comparative and contextual. Quality can help a user prioritize which structures deserve closer review, compare similar detections, and understand why the system retained a pattern. It should be read after symbol, timeframe, Action, and Status—not used as a shortcut that makes those fields unnecessary.
Three different concepts
Quality measures structural fit. Probability, when available, represents a probability field selected for the signal’s current lifecycle stage. Confidence may be used for later states when the corresponding data exists. The words may sound similar, but the platform keeps them separate because they answer different questions.
While a pattern is FORMING, CANDIDATE, or AWAITING_CONFIRMATION, the relevant probability may concern formation. After CONFIRMED or BROKEN, a directional probability may be selected according to whether the realized direction matches the classical pattern bias or moves opposite to it. At another stage, confidence may be the relevant value. When no appropriate value is available, the signal says “Probability: Not available yet.” That phrase means the field is unavailable for the present state; it does not mean 0%, 50%, or 100%.
A common mistake is to read Quality 90/100 as “90% probability of success.” Another is to combine an 80-point Quality score with a displayed target percentage to create an invented confidence level. Neither calculation is supported. Keep each field attached to its label, understand which lifecycle stage selected it, and avoid turning descriptive measurements into statistics they were not designed to provide.
A strong structure can succeed
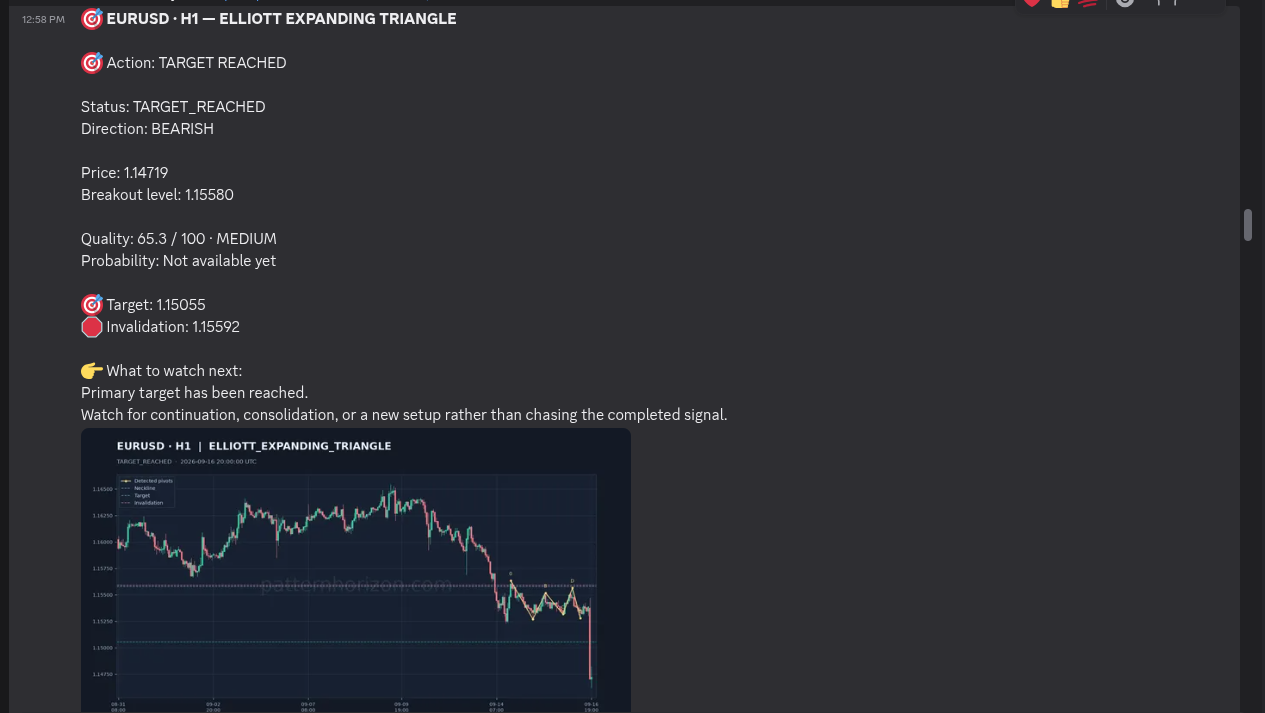
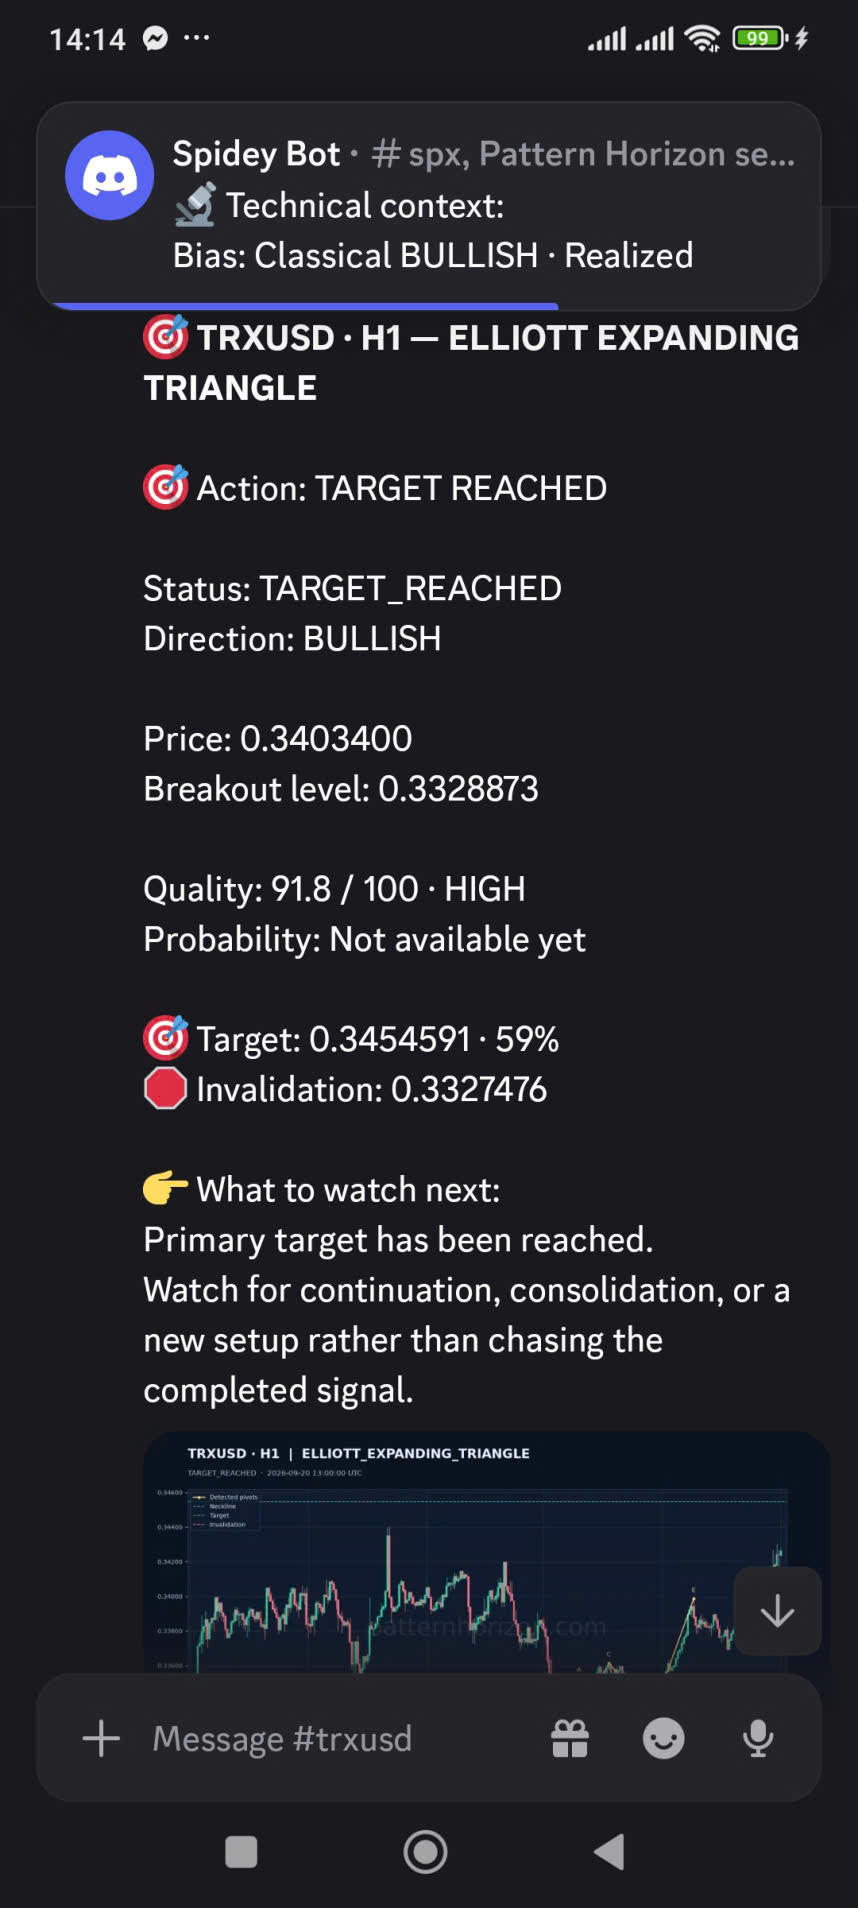
The illustrated signal shows a HIGH-quality Elliott structure whose primary target was later recorded as reached. This is a useful example of structural assessment and lifecycle outcome pointing in the same direction. It is not proof that all HIGH patterns succeed, nor does one completed setup establish a performance rate.
Read the message in sequence. TARGET_REACHED is the current Status and “Primary target has been reached” is the lifecycle guidance. Direction describes the setup’s orientation. Quality reports the earlier structural assessment. Target and Invalidation show the setup’s tracked boundaries. None of these fields converts the completed event into a new entry signal. The “What to watch next” section specifically encourages users to watch for continuation, consolidation, or a new setup rather than chase the completed signal.
Examples are best used to learn field relationships, not to estimate accuracy. Meaningful performance conclusions require a sufficiently large, clearly defined dataset with consistent treatment of symbol, timeframe, pattern family, confirmation, invalidation, incomplete setups, costs, and the period studied.
Review current signals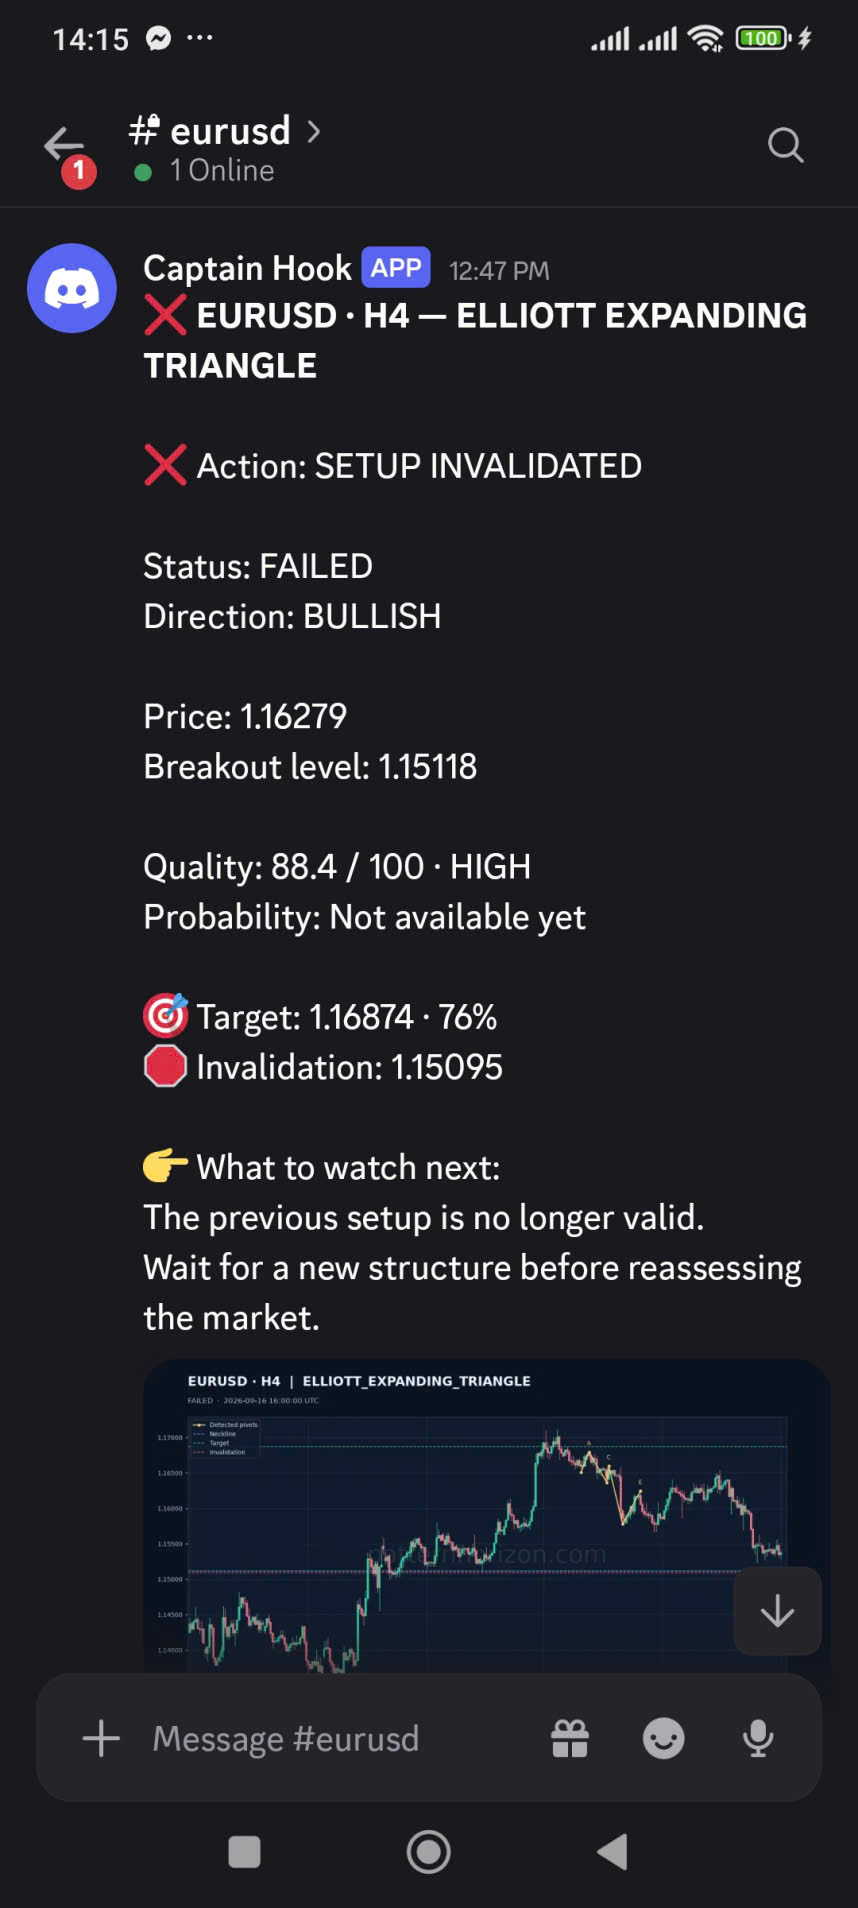
A strong structure can also fail
The second example shows a HIGH-quality Elliott setup that later became FAILED. That outcome does not necessarily mean the Quality field was calculated incorrectly. The field described the pattern’s structure at the time of assessment; the later price path crossed the setup’s invalidation condition. Structural quality and lifecycle outcome are intentionally recorded as different facts.
This separation is important for honest analysis. If a platform silently removed or downgraded every failed high-quality detection after the fact, users would lose the history needed to understand uncertainty. Pattern Horizon preserves the transition and states that the previous setup is no longer valid. It advises waiting for a new structure before reassessing the market.
FAILED is also not an automatic signal in the opposite direction. A bullish setup failing does not by itself confirm a bearish setup, and a bearish failure does not create a bullish entry. The invalidation closes the previous hypothesis. New directional evidence must be detected and evaluated on its own terms.
Open the signal feedQuality needs context
A Quality score belongs to a specific symbol, timeframe, pattern, and event. An H1 structure and an H4 structure may both be valid observations while describing different market horizons. The higher score does not automatically decide which timeframe matters to a user’s method. Compare like with like and verify the timeframe before interpreting the number.
Confirmation is another separate layer. A HIGH-quality pattern can remain AWAITING_CONFIRMATION because price has not satisfied the configured boundary condition. Treating quality as confirmation erases one of the most important safeguards in the lifecycle. Read the Breakout level, Action, Status, and Invalidation alongside the score.
Directional context can also disagree with the classical pattern. Classical bias describes the pattern’s textbook orientation; Realized breakout records the direction that actually occurred when available; Alignment indicates whether they agree. Nearby support or resistance and multi-timeframe zone conflicts can lead to WAIT / NO CLEAR EDGE or UNCLEAR even when an individual formation looks strong.
Quality tells you that a structure deserves attention. Context tells you whether that structure currently has a clear, confirmed, and still-valid role.
A disciplined review
This sequence keeps the score in its proper place and reduces the risk of anchoring on a large number.
Confirm which market and analytical horizon produced the score. Do not transfer a quality assessment to another timeframe.
Understand whether the message concerns Elliott structure, another chart pattern, or a support/resistance zone with a different scoring context.
Determine whether the setup is forming, awaiting confirmation, confirmed, invalidated, or completed before focusing on score magnitude.
Use each value only for the question stated by its label, and treat Not available yet as missing data rather than an implied percentage.
Locate the boundary that advances the setup, the objective tracked by the lifecycle, and the condition that ends the current interpretation.
Open the full analysis to compare bias, alignment, zones, validation, and later events before making an independent risk decision.
About accuracy claims
It is reasonable to ask whether HIGH-quality patterns perform better than MEDIUM- or LOW-quality patterns, or whether Quality behaves differently on H1, H4, and D1. Those questions require a formal study rather than anecdotal examples. The analysis should define the pattern family, data source, sample period, sample size, symbols, timeframes, confirmation rule, target definition, invalidation rule, expiry handling, and treatment of setups still open at the end of the period.
Results should distinguish formation, confirmation, target reached, invalidation, and measured market excursion. They should also avoid presenting historical outcomes as guaranteed future performance. If transaction costs or executable returns are discussed, spreads, slippage, fees, and realistic timing must be addressed.
Until such a report is completed and reviewed, Pattern Horizon should not publish claims such as “90 Quality equals a 90% win rate” or “H4 is always more accurate than H1.” The responsible use of Quality is as structured context within an evolving signal—not as a marketing statistic.
Keep the score in context
Open current signals and practice reading the score only after symbol, timeframe, Action, Status, and Direction.
View signalsImportant information
Pattern Horizon provides market information and educational content only. Quality scores, labels, probability fields, targets, and invalidation levels are not personalized investment advice and do not guarantee profit or prevent loss. Patterns can fail, market conditions can change quickly, and actual execution may differ from displayed references.
Independently verify current prices and conditions, understand the instrument, account for liquidity, spread, slippage, leverage, and possible loss, and decide whether any setup fits your own method and circumstances. Seek qualified professional advice where appropriate.