
1. Verify symbol and timeframe
Identify the exact market and candle interval that produced the zone.
Article
Learn how Pattern Horizon tracks support and resistance through APPROACHING, TOUCHING, IN_ZONE, PIERCED, REJECTED, and BROKEN—and why zone interaction is not automatically a buy or sell signal.
Support and resistance guide
Support and resistance are areas where price can interact, not guaranteed walls. Pattern Horizon records that interaction as a lifecycle: price can approach a zone, touch it, trade inside it, pierce it, reject from it, or satisfy the conditions for a break. Each state describes evidence observed so far. None should be converted automatically into a personal buy or sell order.

Begin with the object
A support or resistance signal normally contains a lower and upper boundary. The interval matters because markets can react before the center, enter part of the range, move through it temporarily, or retest it after leaving. Treating only one price as the level can hide the interaction that the lifecycle is designed to describe.
Support marks an area where buying interest may appear or selling pressure may weaken. Resistance marks an area where selling interest may appear or buying pressure may weaken. These are descriptions of market structure, not guarantees. Support can break; resistance can break; either zone can be revisited or change its contextual role.
Read the symbol, timeframe, zone role, zone boundaries, current Price, Status, Action, Direction, and Zone score together. An H1 zone and H4 zone can overlap while remaining separate analytical objects.
State 1
APPROACHING indicates that price has entered the configured proximity threshold around a support or resistance area. The zone is now relevant to monitor, but meaningful interaction has not necessarily occurred. The appropriate question is how price behaves as it reaches the boundaries.
At this stage, Direction can remain NEUTRAL and Action can remain WATCH. It would be premature to call a support bounce or resistance rejection before price actually interacts with the area. Likewise, a rapid move toward the zone is not proof that it must break.
Distance can be interpreted relative to volatility, such as an ATR-based threshold, rather than as the same fixed number for every market. This is one reason the visual distance on a chart should not be judged without symbol, timeframe, volatility, and the recorded state.
States 2 and 3
TOUCHING means price has reached the zone or the system's interaction threshold. IN_ZONE means current price is contained within the zone boundaries. Both states provide stronger location evidence than APPROACHING, but neither confirms rejection or breakout.
The Action can become WAIT FOR REACTION. That wording matters. A trader who assumes “touching support equals buy” or “inside resistance equals sell” removes the uncertainty that the Status is preserving. Price can leave in the expected direction, continue through the zone, remain inside, or form conflicting evidence.
Check how deeply price has entered the range, whether nearby zones overlap, and whether a higher timeframe adds opposing context. A local H1 support touch inside H4 resistance can be a valid observation while the integrated Direction remains UNCLEAR.
Read location before prediction
A structured zone review begins with four facts: where the range starts and ends, which timeframe produced it, where current price sits relative to it, and which state has actually been recorded. Only then should the user consider the next observable event.
For APPROACHING, watch the first interaction. For TOUCHING or IN_ZONE, wait for a clearer reaction or valid break. For PIERCED, determine whether price merely crossed part of the area or satisfied the full break condition. For REJECTED or BROKEN, monitor follow-through and possible re-entry.
This sequence prevents a wick, temporary penetration, or favorable-looking candle from being promoted into a state the system has not recorded.
Open current signalsState 4
PIERCED describes price moving into or through part of a zone without meeting the stronger conditions required for BROKEN. The distinction protects users from treating every wick or temporary excursion as a confirmed breakout.
A pierced resistance can still reject price; a pierced support can still recover. Alternatively, penetration can develop into a valid break when later evidence satisfies the configured rule. The current Status should therefore remain the anchor. Do not anticipate BROKEN simply because the chart briefly appears beyond a boundary.
Timeframe matters. A lower-timeframe candle can cross a level while the higher-timeframe condition remains unresolved. Check the event timestamp, whether the relevant candle is complete, and whether the full analysis reports cross-timeframe conflict.
State 5
REJECTED means price has moved away from the area in a manner classified as a rejection. For a support zone, the resulting Direction can be BULLISH; for resistance, it can be BEARISH. This describes the observed response and its orientation—not guaranteed continuation.
A rejection can be followed by further movement, consolidation, another test, or a later break. Check whether the signal remains current and whether a newer state has superseded the rejection. One reaction should not be treated as proof that the zone will hold forever.
Zone score can help describe the level's assessed quality or confluence, but it does not convert REJECTED into a win probability. Read the score with role, state, timeframe, opposing zones, and subsequent history.
State 6
BROKEN is stronger than TOUCHING, IN_ZONE, or PIERCED. It records that the system's break condition for the zone has been met. A broken support generally produces a BEARISH Direction; a broken resistance generally produces a BULLISH Direction.
The next question is whether price holds beyond the area or quickly re-enters it. BROKEN records the boundary event; it does not guarantee unlimited continuation or prevent a retest. The old role can also become part of later context, but a role reversal should be supported by new evidence rather than assumed immediately.
Do not borrow the break from another timeframe. An H1 resistance break does not automatically mean an H4 resistance zone is broken. Each zone retains its own range, timeframe, evidence, and state.
Lifecycle is evidence-driven
The conceptual path APPROACHING → TOUCHING → IN_ZONE → REJECTED or BROKEN is useful for learning, but live markets can move quickly. Depending on update timing and configured conditions, a zone can progress through several observations rapidly, return after leaving, or generate a newer event that changes the current reading.
PIERCED is not mandatory before every BROKEN state, and price does not have to remain IN_ZONE for a fixed visible duration before rejection. The engine evaluates conditions; the lifecycle records the resulting event history.
Always use the latest Status and timestamp. Earlier Telegram or Discord notifications remain historical snapshots. Open the website's full analysis when several updates exist, and avoid acting on an older message after a more recent state has been recorded.

When zones compete
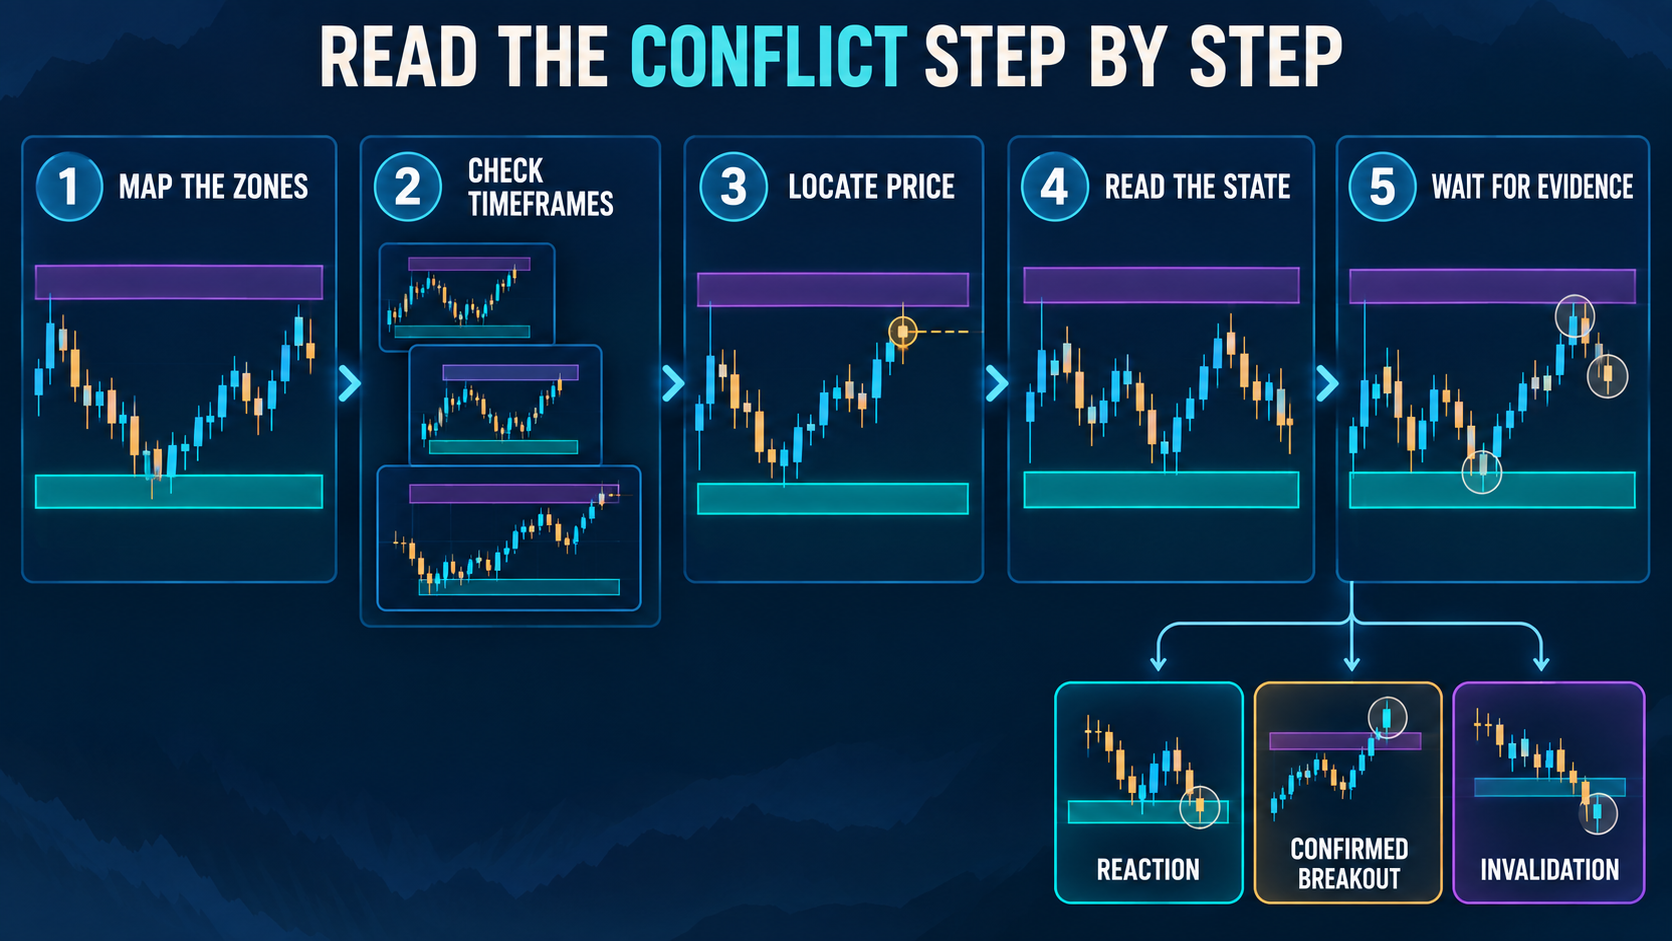
Pattern Horizon can identify opposing zones on the same timeframe or conflict across timeframes. In those cases, an individual zone may be TOUCHING or IN_ZONE while the integrated Action becomes WAIT / NO CLEAR EDGE and Direction becomes UNCLEAR.
The three illustrated contexts are overlapping support and resistance, a lower-timeframe zone opposed by a higher-timeframe zone, and price compressed between nearby opposing areas. None requires the system to choose a winner before evidence exists.
Conflict is not another step after BROKEN. It is contextual information that can be active alongside a zone state. Read the underlying role and Status, then read the conflict layer that explains why the summary remains cautious.
Read the conflict guideA seven-step zone review
The order keeps location, evidence, and context separate from personal execution decisions.
Identify the exact market and candle interval that produced the zone.
Treat support or resistance as a range with a lower and upper edge, not one guaranteed line.
Determine whether price is outside, touching, contained within, or beyond the range.
Use the state actually recorded and follow WATCH, WAIT FOR REACTION, or the relevant later guidance.
NEUTRAL, BULLISH, BEARISH, and UNCLEAR describe current interpretation, not personalized orders.
Review Zone score, confluence, opposing zones, and multi-timeframe context without treating any score as certainty.
Confirm the latest event and independently account for volatility, liquidity, spread, slippage, leverage, and possible loss.
Common mistakes
Avoid “support equals buy” and “resistance equals sell.” APPROACHING is not TOUCHING, TOUCHING is not REJECTED, PIERCED is not BROKEN, and BROKEN is not guaranteed continuation. Each state reduces one uncertainty while leaving others unresolved.
Do not ignore the zone width, timeframe, timestamp, or opposing context. Do not select only the timeframe that supports a preferred direction. Do not interpret a high Zone score as a probability of profit. Do not keep using an old rejection after a newer break has been recorded.
Finally, remember that Telegram and Discord deliver state updates. The website's full analysis and history provide the context needed when several zones or timeframes interact.
Follow the evidence
Open a current support or resistance signal and compare its role, range, Status, Action, Direction, and conflict context.
View signalsImportant information
Pattern Horizon provides market information and educational content only. Support, resistance, zone states, scores, directions, and actions are not personalized investment advice and do not guarantee a bounce, breakout, profit, or protection from loss. Price can move rapidly through a zone and actual execution can differ from displayed references.
Independently verify current prices and conditions, understand the instrument, and decide whether any setup fits your own method and circumstances. Account for liquidity, volatility, spread, slippage, leverage, and possible loss, and seek qualified professional advice where appropriate.