
1. Where are the zones?
Map the lower and upper boundaries of support and resistance. Note the overlap, distance between zones, and whether a previous role may have changed.
Article
Learn how to read overlapping or opposing support and resistance zones, compare timeframes, interpret signal states, and wait for observable evidence before forming a directional view.
Signal education
A Support / Resistance Conflict appears when market structure does not offer one clean directional edge. Price may be inside overlapping zones, caught between support below and resistance above, or reacting to levels that disagree across timeframes. Pattern Horizon marks this context so the trader does not mistake a nearby level for a confirmed opportunity. The useful question is not “Which side must win?” but “Where is price, what evidence is present, and what observable event would reduce the conflict?”

Start with the concept
Support describes an area where buying interest or a reduction in selling pressure may appear. Resistance describes an area where selling interest or a reduction in buying pressure may appear. Neither one is a wall. Price can react before a zone, trade through part of it, pierce its boundary, remain inside it, or break through and later retest it.
A conflict exists when these contextual readings compete. A support zone may overlap a resistance zone. A lower timeframe may show support while a higher timeframe places price at resistance. Price may also sit between two nearby opposing zones, leaving limited room before the next obstacle. In each case, the signal is warning that the available structure does not justify a strong directional interpretation yet. Conflict means “evidence is competing,” not “the system has failed.”

Three common contexts
The first type is overlapping zones on the same timeframe. Here, part of the price range has been classified as both supportive and resistive. The overlap often reflects repeated two-way reactions or a transition in the zone’s role.
The second type is a cross-timeframe conflict. For example, a lower timeframe may show a local support reaction while a higher timeframe still places price inside resistance. Both observations can be valid because they describe different analytical scales.
The third type occurs when price is between opposing zones: support sits below and resistance sits above. The zones do not need to overlap for the market to be constrained. If the distance between them is small relative to current volatility, neither direction may offer a clear edge. Pattern Horizon can surface these contexts so the user knows why a neutral or WAIT-style reading appears.
Explore signalsHow Pattern Horizon presents it
Pattern Horizon recognizes an opposing-zone conflict in the same-timeframe market context and can also identify a cross-timeframe zone conflict. When either condition is present, the web presentation marks the signal as a conflict and uses a safe action such as “Wait / no clear edge.” The accompanying guidance asks the user to wait for price to leave the overlapping support/resistance area and show a clear reaction or a confirmed breakout.
This message is intentionally cautious. It does not predict whether support or resistance will win, and it does not turn a technical label into an order. The conflict flag should be read beside the signal group, zone role, current lifecycle status, direction, quality, relevant prices, and event history. A neutral direction can be appropriate even when individual components appear bullish or bearish, because the combined context is still unresolved.
Read the fields together
Begin with the symbol and timeframe. Then identify whether the displayed key level is a support zone, resistance zone, breakout boundary, or another reference. A zone should have lower and upper boundaries; treat the entire interval as relevant rather than focusing on one exact price. Check whether the technical context says opposing-zone conflict, cross-timeframe zone conflict, immediate resistance with support below, immediate support with resistance above, or price between opposing zones.
Next, read the current status and direction. `APPROACHING` means price has not yet tested the zone. `TOUCHING` or `IN_ZONE` means interaction is occurring, not that the reaction has succeeded. `PIERCED` can indicate that price moved through part of a zone without completing a confirmed break. `REJECTED`, `BROKEN`, `AWAITING_CONFIRMATION`, `CONFIRMED`, and `INVALIDATED` describe different later conditions. Finally, review quality, probability fields when available, invalidation, targets, and event history—but never interpret a quality or probability value as a guaranteed result.
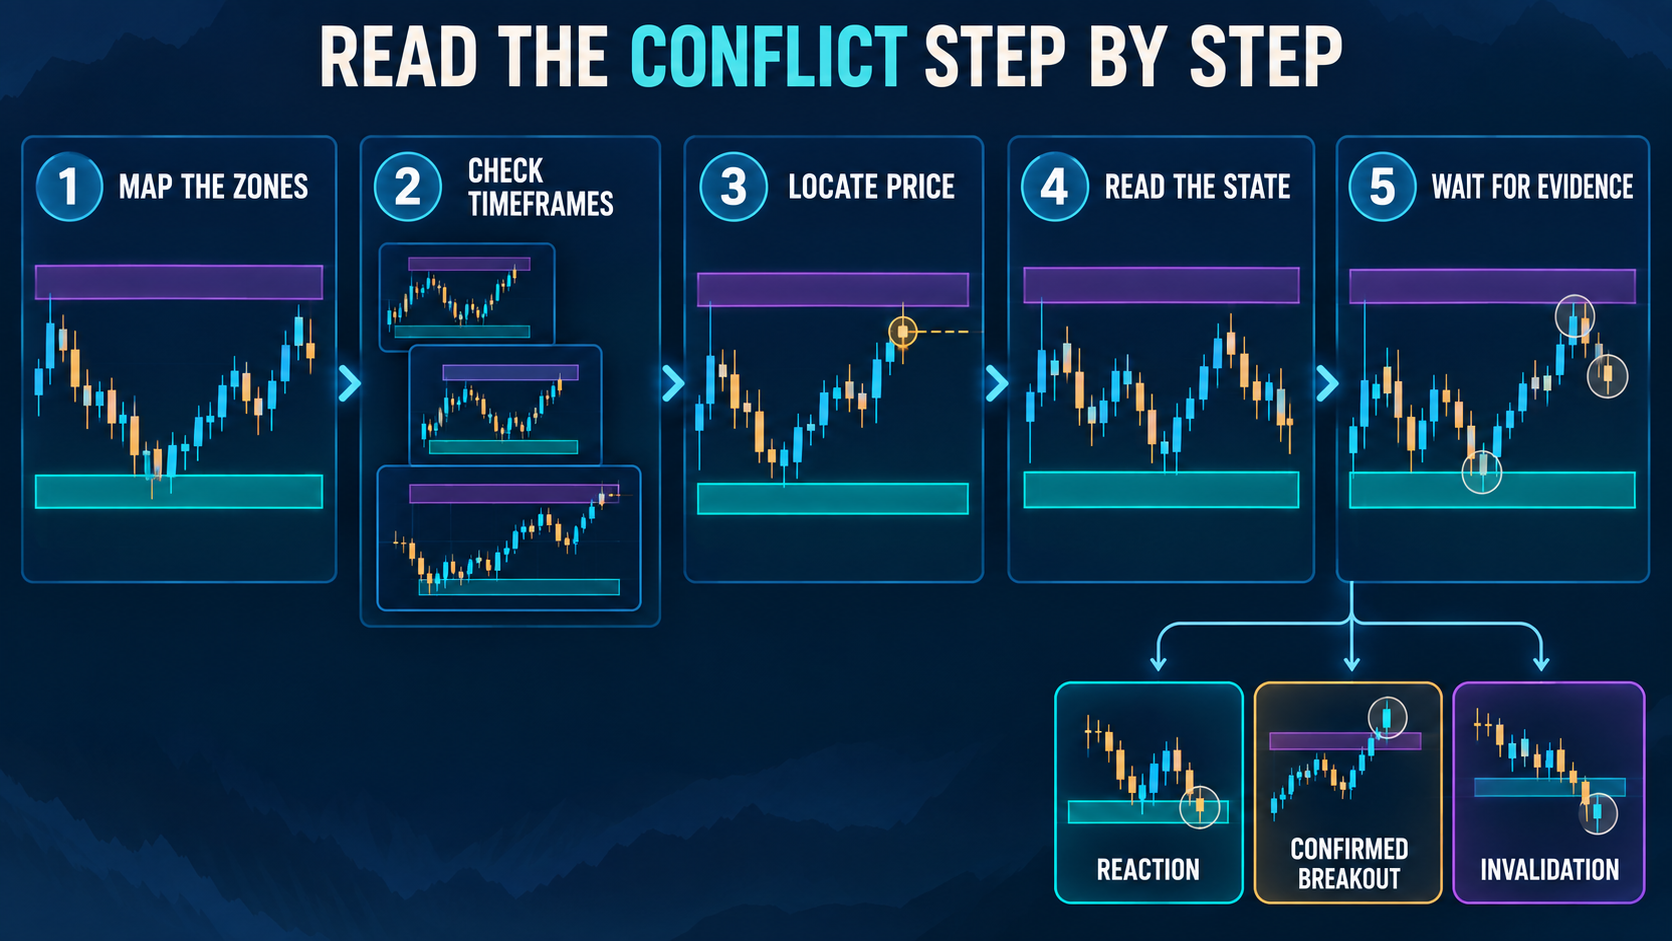
A five-step framework
A conflict becomes easier to understand when the trader separates location, timeframe, state, and evidence instead of collapsing them into one directional opinion.
Read the lifecycle guidePractical workflow
These questions organize the review. They are not a recommendation to enter a trade.
Map the lower and upper boundaries of support and resistance. Note the overlap, distance between zones, and whether a previous role may have changed.
Separate local structure from higher-timeframe context. A short-term support reaction can occur inside a longer-term resistance zone without resolving the larger conflict.
Determine whether price is approaching, touching, inside, piercing, leaving, or holding beyond the relevant area. Location should be read with the event timestamp and current market price.
Do not promote interaction into confirmation. Read the lifecycle status, direction, conflict flag, quality, and latest event together.
Define observable conditions: a clear rejection, a close and hold outside the zone, a confirmed breakout, a failed break that re-enters the area, or invalidation of the prior setup.
Possible next evidence
A reaction means price responds at or near a zone. It can be useful evidence, but one candle or brief move may not be enough to establish continuation. The system may therefore show `WAIT_FOR_REACTION` while the zone is approaching or being tested. A rejection becomes more meaningful when price moves away from the area and subsequent behavior supports that reading.
A confirmed breakout requires more than a temporary excursion beyond a boundary. The configured confirmation condition must be met, and the trader should distinguish `PIERCED` from `BROKEN` or `CONFIRMED`. After a break, observe whether price holds beyond the zone or quickly re-enters it. Invalidation is different again: it means the prior setup no longer satisfies its defining conditions. When invalidated, the responsible response is to reassess from new structure rather than defend the old directional idea.
Multi-timeframe context
Timeframes answer different questions. A short timeframe may capture a local bounce, rejection, or micro-breakout. A higher timeframe may show that the same move is occurring inside a much larger resistance or support area. Treating these observations as mutually exclusive can lead to confusion; treating them as identical can hide risk.
When Pattern Horizon shows a cross-timeframe zone conflict, identify which timeframe supplies each zone and which one matches the holding period you are evaluating. A lower-timeframe confirmation may describe a short move without resolving the higher-timeframe obstacle. Conversely, a higher-timeframe level may remain important even if lower-timeframe price temporarily crosses it. Look for alignment, a confirmed change in the higher-timeframe structure, or enough separation from the conflicting area before adopting a stronger view.
Common mistakes
The first mistake is assuming that support automatically means buy or resistance automatically means sell. Zones describe where reactions may matter; they do not prescribe an action. The second mistake is choosing only the timeframe that supports a preferred direction. The third is treating a wick or brief pierce as a confirmed breakout. The fourth is reading quality or probability fields without checking their label, scale, and availability. The fifth is ignoring how much room remains before the opposing zone.
Another mistake is reacting to the notification while skipping the detail page. Telegram or Discord can draw attention to an update, but the signal’s structured context and lifecycle history belong on the website. Finally, do not keep the original thesis after the signal is invalidated. A conflict can resolve in either direction, remain unresolved, or develop into a new structure that deserves a fresh assessment.
Risk and responsibility
A Support / Resistance Conflict is often most valuable as a reason to slow down. `NO_CLEAR_EDGE`, `WAIT_FOR_REACTION`, and `WAIT_FOR_CONFIRMATION` communicate that the system has not observed enough evidence for a stronger reading. Doing nothing until the context changes can be a deliberate decision rather than a missed opportunity.
If a trader later chooses to act, risk still needs to be defined independently. Check current price, spread, liquidity, volatility, execution conditions, invalidation logic, and total account exposure. Pattern Horizon does not select position size, execute trades, or guarantee that a rejection or breakout will continue. Its role is to organize market information so the user can see the conflict, monitor its lifecycle, and decide whether the eventual evidence fits a personal trading plan.
See the pattern before the horizon shifts
Open an available signal, inspect its market levels, and follow the next recorded state change before forming a stronger directional view.
Explore signalsImportant information
Pattern Horizon provides market information and educational content only. It is not personalized investment, financial, legal, or tax advice and does not guarantee results. Trading and investing involve risk, including the possible loss of capital. Independently evaluate every decision and seek qualified professional advice where appropriate.